
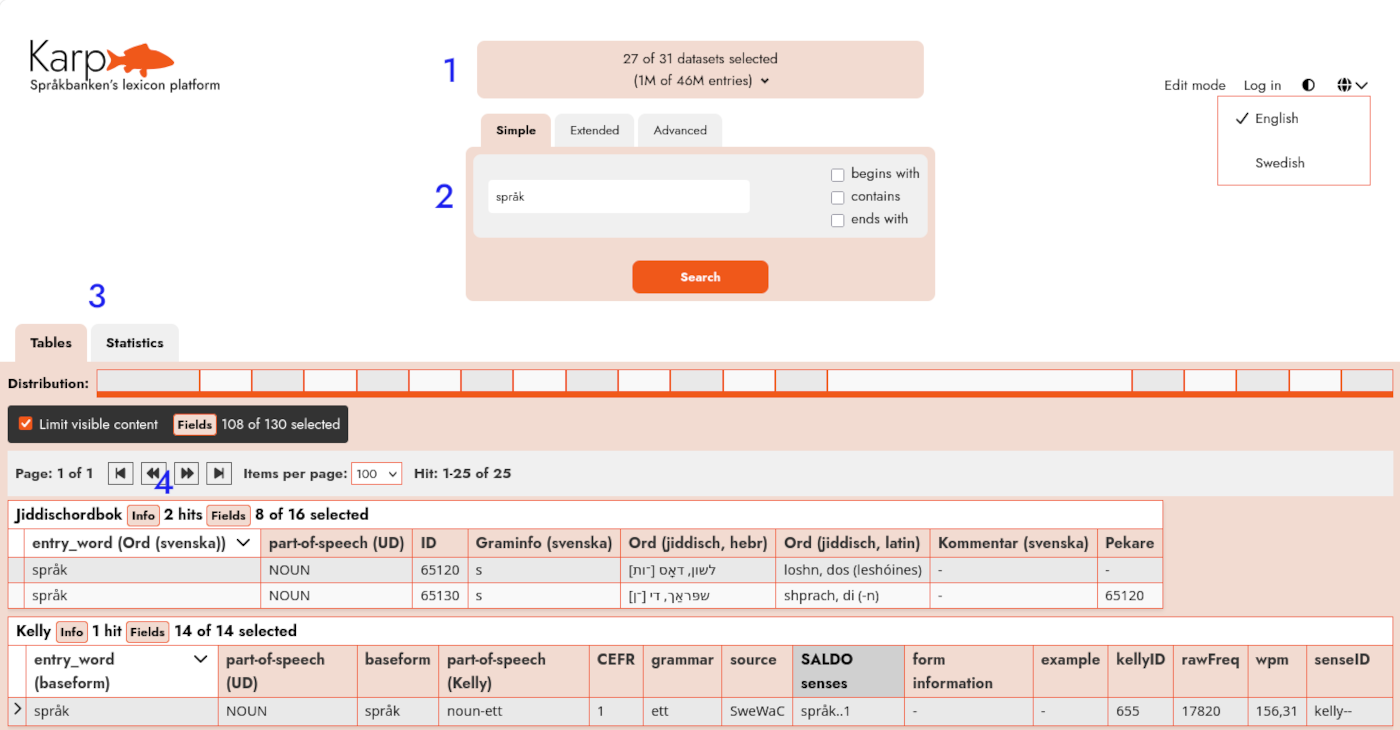
1. Data selector. Select a dataset, for example a dictionary such as “SAOL 8”. You can also choose to search across groups of dictionaries by clicking “Deselect all” and then, for example, “Svenska Akademiens ordböcker”.
2. Search box. Enter your search in the search box. The simple search searches entry words, while under “Advanced” you can choose to search specific fields/columns and combine different searches using AND and OR. Click the “Search” button to perform the search.
3. Results view. You can view the results either as a table or as statistics, under the “Tables” and “Statistics” tabs respectively.
The “Distribution” row provides an overview. Hover over the different areas to see the number of hits broken down by dataset.
4. Browsing the results. You can browse through the results using the arrows.
In the table view, you can click the link in the “Source” column to display a facsimile of that page. Click the small icon to browse between facsimiles.
You can also choose which fields to display by clicking the “Fields” button.
In the statistics view, you can choose which field/column to compile on and which values to display.
Words shown in blue are clickable. Clicking one opens that entry in a new tab.
If you have selected “Count” under “Display”, you can also view the results as a graph.
You normally do not need to log in. Login is only required if you want to search a restricted dataset.